PHP does not have a direct equivalent to JavaScript's console.log() because the two languages normally execute in different places.
JavaScript runs in the browser, where the browser's developer console exists. PHP normally runs on the web server, completes its work, and sends an HTTP response back to the browser.
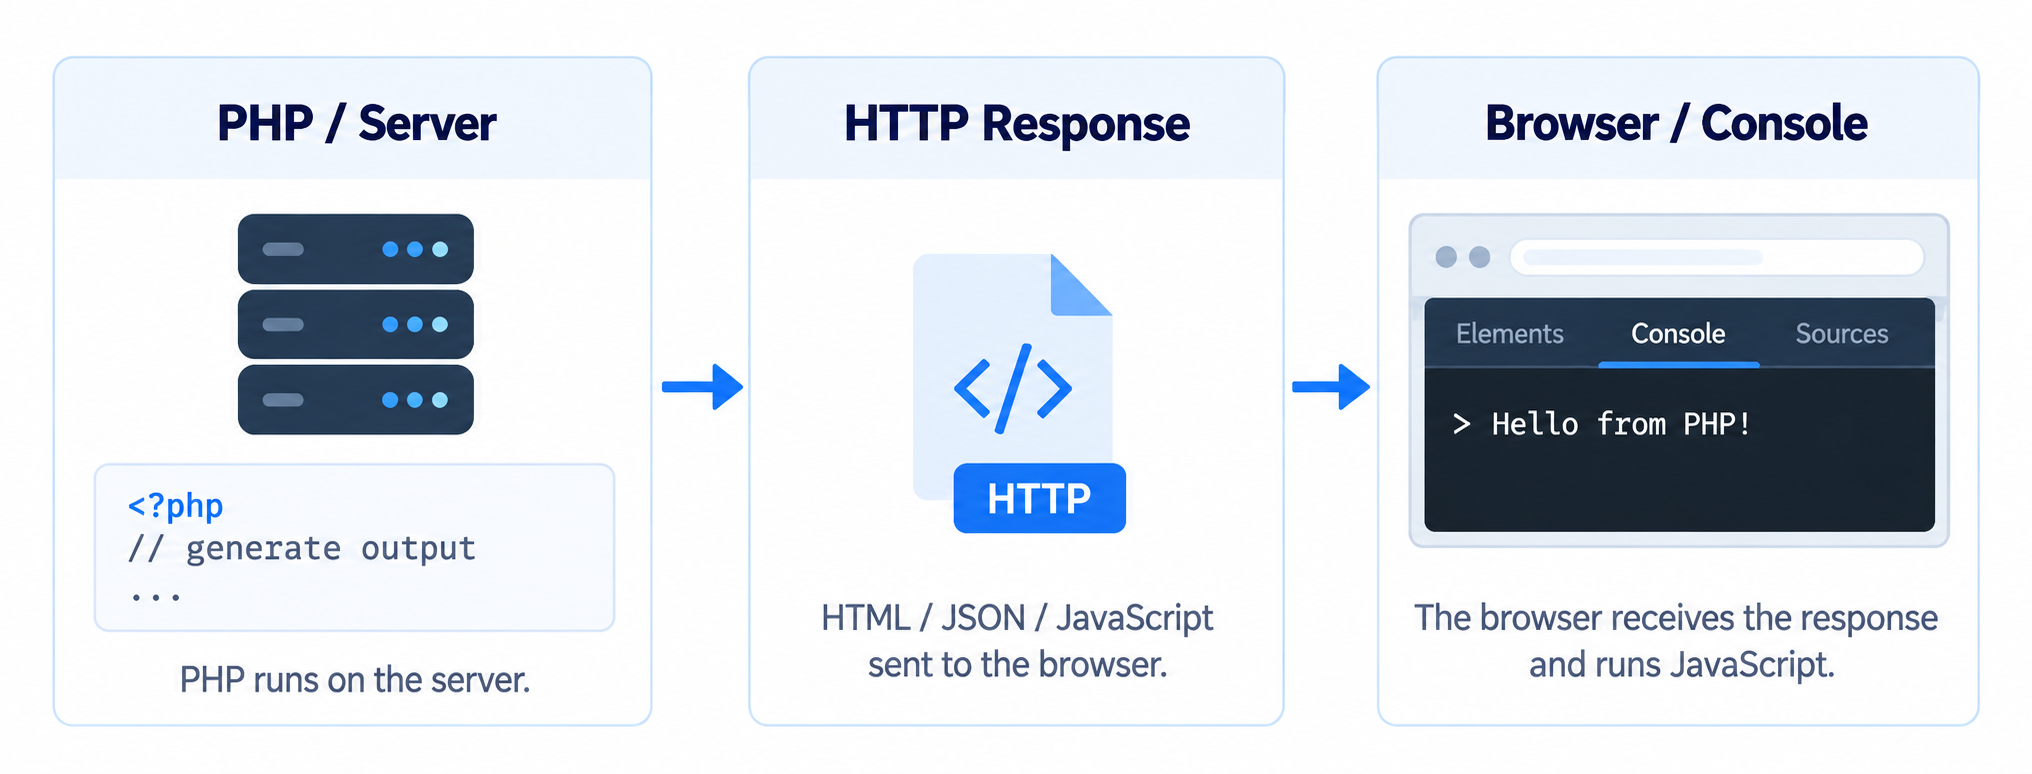
Because of that, when someone asks how to "log to the console using PHP," there are actually several different things they may mean:
- Send a PHP value to the browser's JavaScript console.
- Inspect PHP variables while developing an application.
- Watch PHP application logs in a terminal.
- Debug PHP execution interactively.
- Collect logs from a production application.
- Monitor requests, queries, jobs, errors, and performance.
There are good solutions for all of these. The best choice depends on what kind of debugging or logging you actually need.
Browser Console and Browser-Based Debugging
These approaches focus on getting server-side PHP debugging information into the browser or its developer tools. They are useful when you specifically want to inspect PHP values alongside the page you are working on, rather than switching to a terminal, log file, or separate debugging application. Some techniques work by generating JavaScript, while others use HTTP headers or browser extensions to bridge the gap between server-side PHP and client-side developer tools. These methods are best suited to development and should be used carefully because browser-visible debugging information can expose internal application details.
1. Generate JavaScript with PHP
The simplest way to send something from PHP to the browser console is to have PHP generate JavaScript containing a call to console.log().
For example:
<?php

$message = 'Hello from PHP';

echo '<script>console.log(' . json_encode($message) . ');</script>';
The browser ultimately receives something similar to:
<script>
console.log("Hello from PHP");
</script>
The browser executes that JavaScript, which causes the message to appear in its developer console.
Arrays can be handled the same way:
<?php

$user = [
    'id' => 42,
    'name' => 'John',
    'active' => true,
];

echo '<script>console.log(' . json_encode($user) . ');</script>';
A reusable helper might look like:
function console_log(mixed $value): void
{
    $json = json_encode(
        $value,
        JSON_HEX_TAG |
        JSON_HEX_AMP |
        JSON_HEX_APOS |
        JSON_HEX_QUOT |
        JSON_UNESCAPED_UNICODE
    );

    echo "<script>console.log($json);</script>";
}
You could then use:
console_log($user);
console_log($_POST);
console_log('Reached payment processing');
Using json_encode() is important. Simply placing an arbitrary PHP string inside JavaScript quotes can break the JavaScript and may introduce security issues when the value contains quotes, markup, or user-controlled data.
This method is convenient for a quick test, but it has substantial limitations:
- It modifies the HTML response.
- It only makes sense for HTML responses.
- It can interfere with redirects, JSON APIs, AJAX responses, downloads, and other non-HTML responses.
- Content Security Policy rules may block inline JavaScript.
- Debug information can accidentally be exposed to users.
It is useful for quick debugging, but should generally not become an application's logging architecture.
2. Chrome Logger
Chrome Logger is a cleaner solution when the specific requirement is:
Send server-side PHP debugging information to the Chrome DevTools console.
Rather than injecting JavaScript into the HTML response, PHP sends specially formatted HTTP response headers. The Chrome Logger extension recognizes those headers and displays their contents in Chrome's developer console.
For PHP, the server-side library referenced by the Chrome Logger project is ChromePhp. It is also available on Packagist:
composer require --dev ccampbell/chromephp
The ChromePhp library is old, so for a new project you should evaluate it before making it part of your long-term debugging stack. However, it makes the mechanics of Chrome Logger explicit: the PHP library creates the X-ChromeLogger-Data response header, and the Chrome extension reads that header and writes the entries into DevTools.
Usage with ChromePhp looks like:
<?php

require __DIR__ . '/vendor/autoload.php';

ChromePhp::log('Hello from PHP');
ChromePhp::log($user);
ChromePhp::warn('Something looks suspicious');
ChromePhp::error('Something failed');
Conceptually, the flow is:
PHP
  ↓
HTTP response header
  ↓
Chrome Logger extension
  ↓
Chrome DevTools Console
PHP itself is still not executing console.log(). The browser extension is translating debugging information from the HTTP response into console messages.
This avoids injecting <script> tags into the page and can work much more cleanly for development.
Chrome Logger is particularly interesting because it illustrates one of the main techniques used historically to bridge server-side PHP debugging with browser developer tools: transport debugging information through HTTP headers.
3. Clockwork
Clockwork is a considerably more powerful browser-based PHP development tool.
Install its server component with Composer:
composer require itsgoingd/clockwork
Then you can send information using:
clock($user);
or:
clock($user, $request, $result);
Clockwork collects much more than manually logged variables. It can provide information about:
- HTTP requests
- application logs
- database queries
- performance
- cache operations
- Redis commands
- events
- queue jobs
- rendered views
- console commands
Clockwork currently provides Chrome and Firefox developer-tools extensions as well as a web application available through the application's /clockwork route.
This makes Clockwork one of the stronger modern choices when you like working inside browser developer tools but want substantially more information than simple console.log() output.
Laravel Development Tools
Laravel has its own ecosystem of debugging and inspection tools that are usually more useful than trying to push every PHP value into a browser console. These tools can expose request details, database activity, queue jobs, application logs, exceptions, timing information, and other framework-specific behavior in a much more structured way. Some are focused on a single request, while others are designed for live log viewing or deeper application inspection. If you are already working inside Laravel, these options should generally be considered before building a custom debugging mechanism.
4. Laravel Debugbar
Laravel Debugbar adds an interactive debugging toolbar to Laravel applications.
The package is now installed as:
composer require fruitcake/laravel-debugbar --dev
The older package name was:
barryvdh/laravel-debugbar
but the current package has moved to:
fruitcake/laravel-debugbar
and remains actively maintained.
You can send your own values to it:
Debugbar::info($user);
Debugbar::warning('Something unusual happened');
Debugbar::error('Something failed');
You can also measure execution:
Debugbar::startMeasure('report', 'Building report');

$report = buildReport();

Debugbar::stopMeasure('report');
The toolbar can show information such as:
- queries
- execution time
- memory usage
- requests
- routes
- views
- exceptions
- log messages
- AJAX requests
Laravel Debugbar should only be enabled in development. Its own documentation specifically warns against exposing it publicly because the information it collects can reveal sensitive application details.
For visually inspecting individual web requests while developing Laravel, Debugbar remains an extremely convenient solution.
5. Laravel Telescope
Laravel Telescope provides a much deeper view into what is happening inside a Laravel application.
Install it with:
composer require laravel/telescope

php artisan telescope:install
php artisan migrate
Its dashboard is normally available at:
/telescope
Telescope can inspect:
- incoming requests
- exceptions
- application logs
- database queries
- queued jobs
- mail
- notifications
- cache activity
- scheduled tasks
- variable dumps
- Redis operations
- outgoing HTTP requests
Laravel's current documentation describes Telescope specifically as a companion for local Laravel development and lists watchers for all of these application activities.
For example, instead of scattering temporary debugging statements throughout an application, you can inspect the request in Telescope and see which queries, events, jobs, logs, and other operations occurred during it.
Telescope is especially useful when the question is no longer just:
What value does this variable contain?
and becomes:
What exactly happened during this Laravel request?
6. Laravel Pail
Laravel Pail is one of the most useful modern additions to Laravel's logging workflow.
Install it with:
composer require laravel/pail
Then run:
php artisan pail
Pail gives you a live console view of Laravel log activity.
Laravel's current documentation describes it as an alternative to simply using the Unix tail command. It can work with different log drivers, including external services such as Nightwatch, Sentry, and Flare.
You can increase verbosity:
php artisan pail -v
or include full exception stack traces:
php artisan pail -vv
You can also filter output.
For example:
php artisan pail --level=error
or:
php artisan pail --message="User created"
This creates something much closer to the traditional programming idea of a console log than opening storage/logs/laravel.log manually.
For Laravel development, this is now an important option to include.
Interactive PHP Debugging
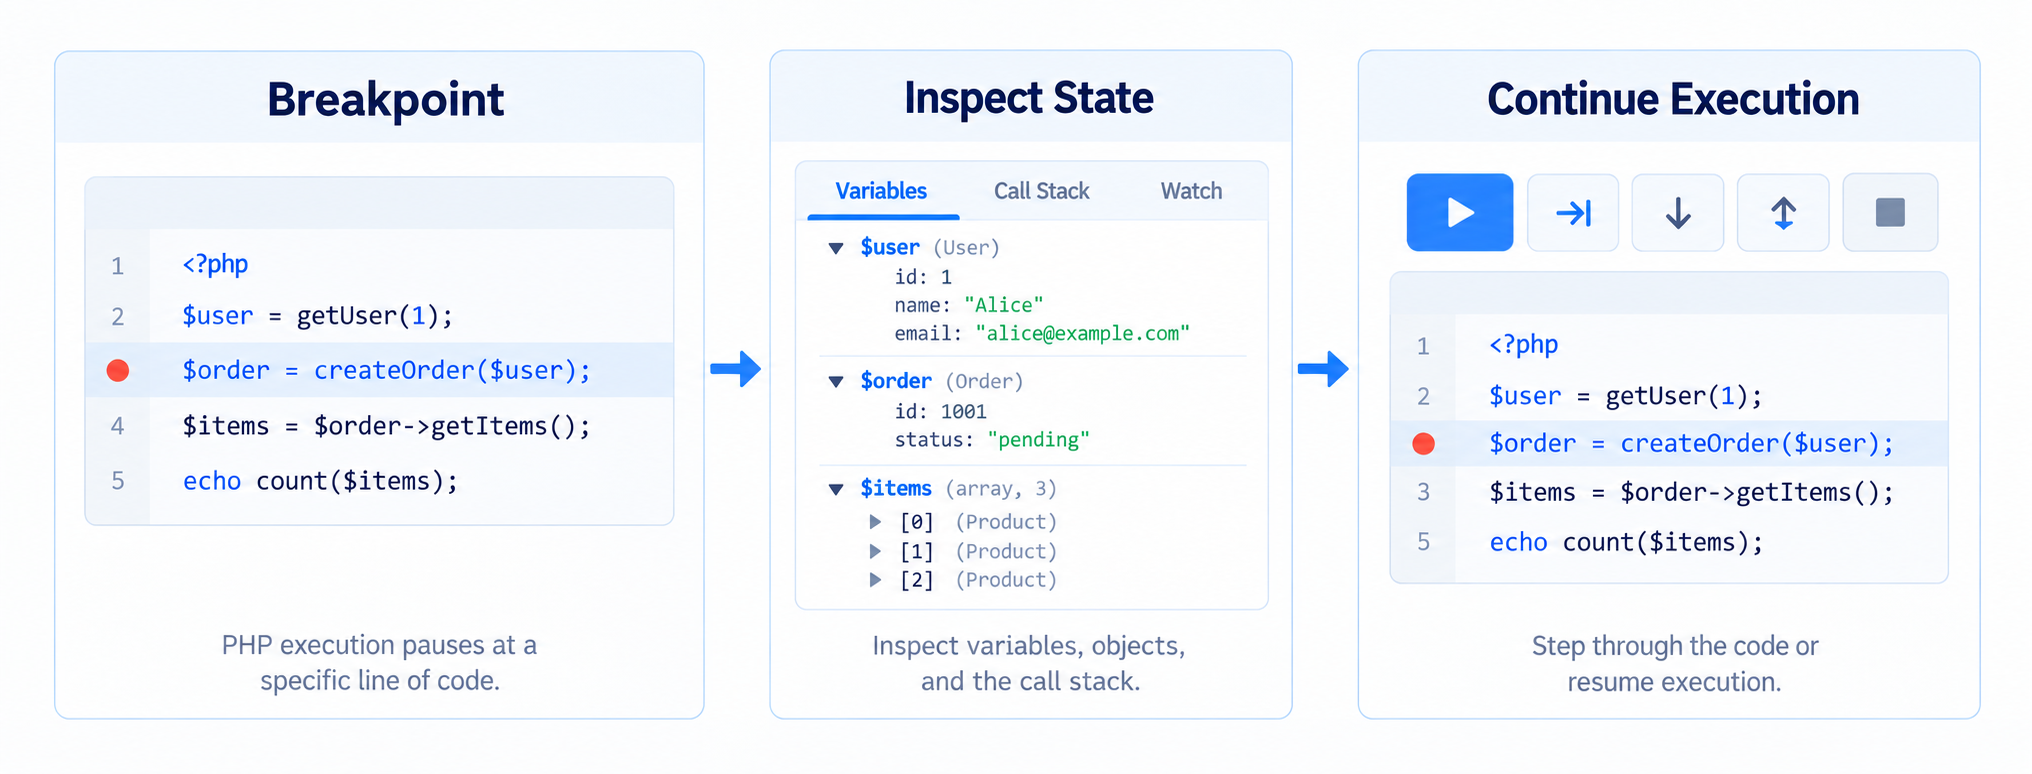
Interactive debugging is useful when the problem cannot be understood by looking at isolated log messages alone. Instead of recording values after the fact, a debugger lets you pause PHP while it is running, inspect the current state of variables and objects, and follow execution one line at a time. This makes it much easier to diagnose branching logic, unexpected state changes, exceptions, and complex call paths. For difficult application bugs, interactive debugging is often more efficient than repeatedly adding and removing temporary logging statements.
7. Xdebug
Xdebug provides real PHP debugging instead of simply printing values.
With Xdebug and an IDE you can:
- create breakpoints
- pause PHP execution
- inspect local variables
- inspect arrays and objects
- examine the call stack
- evaluate expressions
- step into functions
- step over functions
- step out of functions
- inspect exceptions
A basic Xdebug configuration may contain:
xdebug.mode=debug
xdebug.start_with_request=yes
xdebug.client_port=9003
and possibly:
xdebug.client_host=127.0.0.1
depending on the development environment.
With Docker, WSL, virtual machines, or remote development servers, the correct host address may differ.
Instead of writing:
error_log(print_r($user, true));
you can place a breakpoint:
$user = loadUser($id);

// Breakpoint here
and inspect $user directly while the PHP process is paused.
For complicated program logic, Xdebug is usually substantially more useful than console logging.
8. PhpStorm with Xdebug
PhpStorm integrates with Xdebug for interactive PHP debugging.
Once execution has stopped at a breakpoint, PhpStorm lets you inspect:
- variables
- arrays
- object properties
- stack frames
- watches
- exceptions
You can also evaluate PHP expressions in the current execution context.
For example, while stopped inside:
public function processOrder(Order $order)
{
    // breakpoint
}
you could inspect:
$order
or evaluate:
$order->items->count()
without modifying the application's source code.
This is particularly valuable when you need to investigate program flow or complex object state instead of merely recording that something happened.
Variable Dumping and Development Consoles
Variable-dumping and development-console tools sit between simple logging and full interactive debugging. They are designed to make values, arrays, objects, requests, and application state easier to inspect during development without relying on raw var_dump() output. Many of these tools provide cleaner formatting, dedicated debug panels, or separate consoles so debugging information does not have to interfere with the application's normal response. They are especially useful when you want fast visibility into what PHP is doing but do not need to pause execution with a debugger.
9. Symfony VarDumper
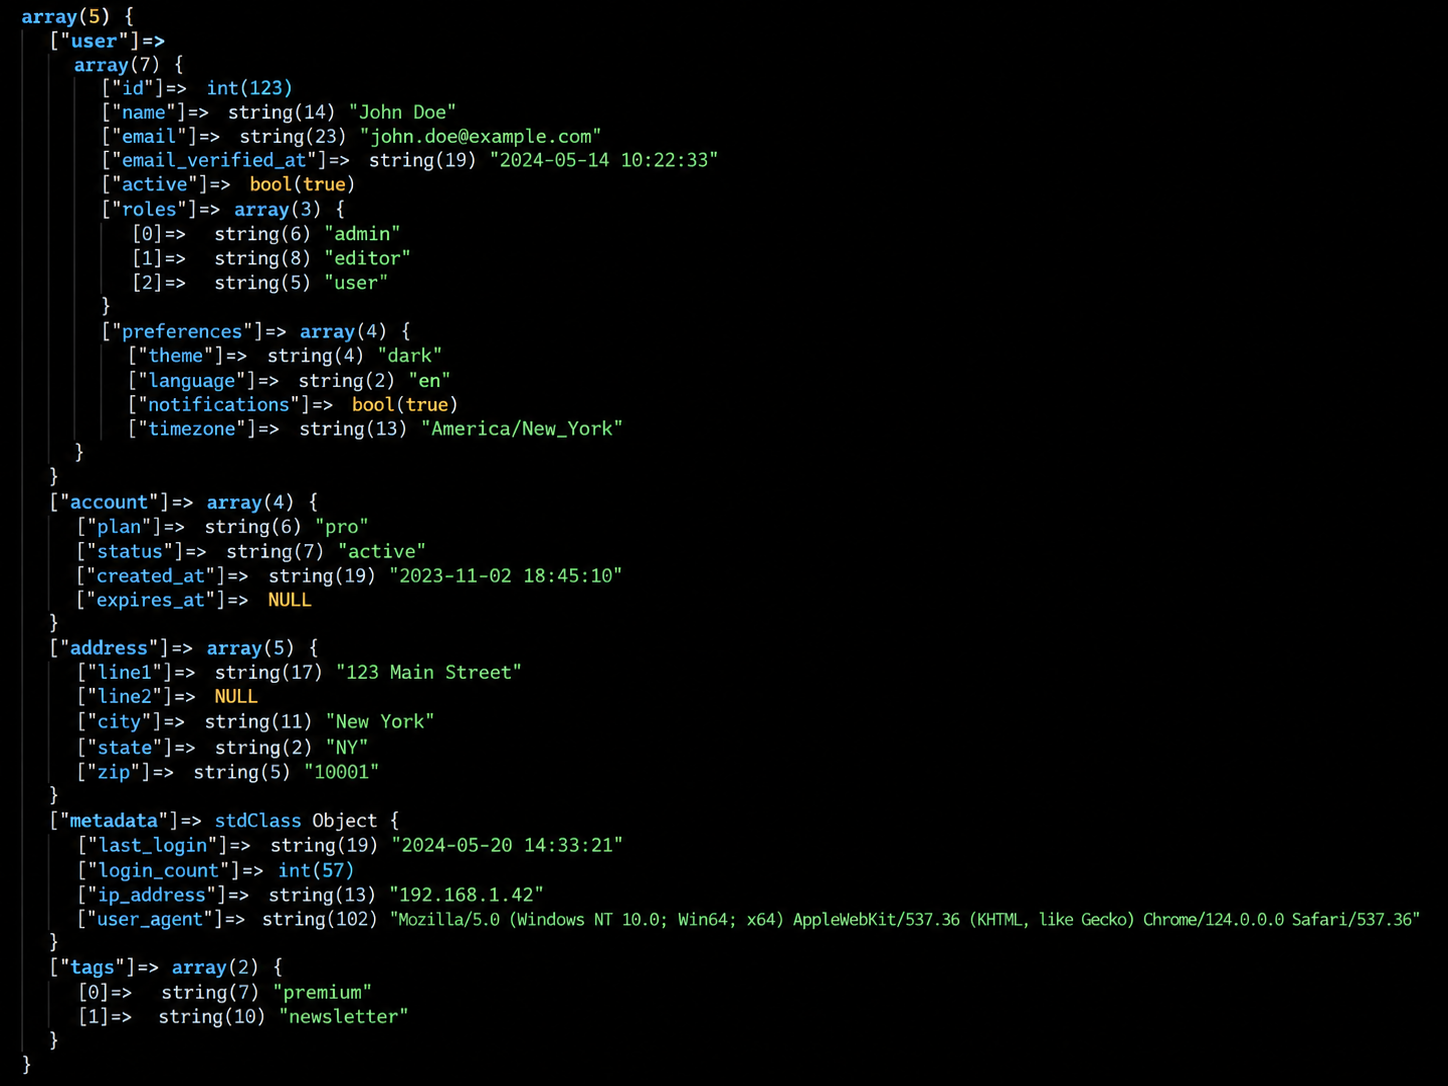
Symfony's VarDumper component provides a much better alternative to PHP's basic var_dump().
It can be installed independently of the full Symfony framework:
composer require --dev symfony/var-dumper
Then:
dump($user);
or:
dd($user);
VarDumper provides much cleaner representations of:
- arrays
- objects
- strings
- resources
- nested structures
It can also send dumps to a separate dump server rather than placing them into the HTTP response.
For example:
./vendor/bin/var-dump-server
You can then continue using:
dump($user);
dump($request);
dump($result);
while the values appear in a terminal window.
This is a particularly nice solution when you want a console-like debugging experience but do not want debugging output contaminating your HTML or JSON response.
10. Symfony Web Profiler
For full Symfony applications, the Symfony Web Profiler goes considerably further.
Install the profiler package in development:
composer require --dev symfony/profiler-pack
Symfony then collects detailed information for requests and exposes it through its web debug toolbar and profiler interface.
The profiler can include:
- routing information
- logs
- database activity
- timing
- cache information
- request details
- response details
- exceptions
- custom data collectors
For non-HTML responses such as APIs, Symfony provides profiler information through headers such as X-Debug-Token-Link, allowing the request to be inspected separately.
Like Laravel Debugbar, Symfony warns that the profiler should not be publicly enabled in production because of the sensitive information it can expose.
11. Ray
Ray provides a dedicated desktop debugging application instead of sending debugging information into the browser.
For a plain PHP project:
composer require spatie/ray
Then:
ray('Hello from PHP');
ray($user);
ray($request, $result);
Ray supports strings, arrays, objects, JSON, XML, stack traces, and many other kinds of debugging information.
For Laravel:
composer require spatie/laravel-ray
Laravel-specific functionality includes features such as displaying executed database queries:
ray()->showQueries();

$user = User::first();
The query will then appear in Ray.
Ray is useful if you like the workflow of writing:
ray($value);
and immediately seeing organized debugging information in a separate application without altering the browser response.
12. Tracy
Tracy is another actively maintained PHP debugging system that can be used outside its native Nette framework.
Install it with:
composer require tracy/tracy
Then enable it:
use Tracy\Debugger;

Debugger::enable();
Tracy provides:
- an on-page debug bar
- variable dumping
- error visualization
- exception information
- logging
- request information
- AJAX debugging
- timing
- memory information
Its current package supports modern PHP versions and remains actively developed.
Tracy is especially useful for plain PHP projects where you want a complete development debugger but are not using Laravel or Symfony.
Proper Application Logging
Browser debugging tools are convenient during development, but real applications need logging that is reliable, structured, and independent of a user's browser. Proper application logging records important events, warnings, failures, and diagnostic context in a form that can be retained and reviewed later. A good logging system also supports log levels, multiple destinations, structured context, and integration with external monitoring systems. These techniques are appropriate for both development and production and should form the foundation of an application's long-term logging strategy.
13. Monolog, PSR-3, and Laravel Logging
Monolog is one of the standard logging libraries used throughout the PHP ecosystem. Laravel's logging documentation covers the framework-specific configuration and channels.
Laravel's logging system uses Monolog internally and exposes it through the Log facade.
For example:
use Illuminate\Support\Facades\Log;

Log::debug('Processing order', [
    'order_id' => $order->id,
]);

Log::info('Order completed');

Log::warning('Inventory is low', [
    'product_id' => $product->id,
]);

Log::error('Payment failed', [
    'order_id' => $order->id,
]);
Laravel supports channels such as:
single
daily
monthly
errorlog
syslog
papertrail
slack
monolog
stack
and can combine multiple channels into a logging stack.
For example, development logs might go to a local file while production errors are simultaneously sent to an external service.
Modern PHP libraries commonly use the PSR-3 logger interface, which means your application can depend on a standard logger interface rather than tightly coupling itself to one logging implementation.
For actual application logging, this is generally preferable to browser-console hacks.
14. PHP's error_log()
Plain PHP includes the built-in error_log() documentation function:
error_log()
The simplest usage is:
error_log('Reached checkout');
You can also log structured values:
error_log(json_encode([
    'user_id' => $user->id,
    'order_id' => $order->id,
]));
Where this message appears depends on PHP's configuration and the server environment.
Depending on the setup, it might ultimately go to:
PHP error log
Apache error log
PHP-FPM log
syslog
stderr
This makes error_log() one of the quickest server-side debugging tools available in plain PHP.
15. Write Directly to a File
error_log() can also write directly to a specific file.
For example:
error_log(
    "User {$user->id} entered checkout\n",
    3,
    '/tmp/application-debug.log'
);
When writing directly to a file, remember to include the newline yourself.
You could then monitor the file from a terminal:
tail -f /tmp/application-debug.log
Structured information can be written as JSON:
error_log(
    json_encode([
        'timestamp' => date('c'),
        'user_id' => $user->id,
        'action' => 'checkout',
    ]) . PHP_EOL,
    3,
    '/tmp/application-debug.log'
);
This is perfectly acceptable for temporary debugging.
For a real application, Monolog or another structured logging system is normally preferable because it provides log levels, rotation, handlers, formatting, and multiple destinations.
16. Use syslog()
PHP can send messages directly to the operating system's system logging facility using syslog() documentation.
For example:
openlog('my-application', LOG_PID, LOG_USER);

syslog(LOG_INFO, 'User logged in');
syslog(LOG_WARNING, 'Unexpected request');
syslog(LOG_ERR, 'Database query failed');

closelog();
Possible priorities include:
LOG_DEBUG
LOG_INFO
LOG_NOTICE
LOG_WARNING
LOG_ERR
LOG_CRIT
LOG_ALERT
LOG_EMERG
On Linux, those messages may ultimately be handled by systems such as:
systemd-journald
rsyslog
syslog-ng
depending on the server configuration.
This approach works particularly well for:
- command-line applications
- workers
- daemons
- cron jobs
- background services
- production servers
17. Configure PHP's Error Logging
PHP itself contains configuration specifically for controlling error logging.
For example:
log_errors = On
display_errors = Off
error_reporting = E_ALL
error_log = /var/log/php/php-error.log
Then:
error_log('Testing PHP logging');
will be routed according to PHP's configured error log.
You can monitor the file:
tail -f /var/log/php/php-error.log
For production systems, errors should normally be logged rather than displayed directly to visitors.
It is important to understand that this is a server-side console/log, not the Chrome or Firefox JavaScript console.
18. Apache, Nginx, and PHP-FPM Logs
The web-server and PHP runtime logs are also important debugging resources.
With Apache, common locations include:
/var/log/apache2/error.log
/var/log/apache2/access.log
or on many RHEL-family systems:
/var/log/httpd/error_log
/var/log/httpd/access_log
You can watch an Apache error log in real time:
tail -f /var/log/httpd/error_log
Applications using Nginx may instead use:
/var/log/nginx/error.log
/var/log/nginx/access.log
When PHP runs through PHP-FPM, PHP-FPM may have its own logs as well.
These logs are particularly useful for diagnosing problems that occur before or around your application code, including:
- request failures
- PHP crashes
- permission problems
- malformed requests
- FastCGI errors
- startup failures
- HTTP status codes
- server configuration problems
Application logging and web-server logging complement each other.
HTTP-Based Debugging Techniques
HTTP-based debugging techniques attach diagnostic information to the request or response itself rather than placing it directly into the page body. This can be useful when debugging APIs, AJAX requests, redirects, or other responses where modifying the content would be inconvenient or invalid. The browser's Network panel can then be used to inspect that information alongside the request that produced it. These methods are best kept lightweight because HTTP headers are intended for metadata, not large dumps, stack traces, or sensitive application data.
19. Send Debug Information in HTTP Response Headers
You can send small debugging values through custom HTTP response headers using PHP's header() documentation function.
For example:
header('X-Debug-User-ID: ' . $user->id);
header('X-Debug-Cache: HIT');
header('X-Debug-Query-Count: 17');
Open the browser's developer tools and inspect:
Network
  → Request
    → Headers
      → Response Headers
You might see:
X-Debug-User-ID: 42
X-Debug-Cache: HIT
X-Debug-Query-Count: 17
This has several advantages:
- the HTML is not modified
- JSON responses remain valid
- the information stays associated with the HTTP request
However, response headers are intended for small amounts of metadata, not huge arrays or stack traces.
This technique is also the foundation behind tools such as Chrome Logger and historically FirePHP.
Never place credentials, authorization tokens, passwords, or other sensitive information into debugging headers.
20. Create a Custom Debug Helper
A custom function can make lightweight debugging much easier in plain PHP applications.
For example:
function debug_log(
    mixed $value,
    string $label = 'DEBUG'
): void {
    if (!defined('APP_DEBUG') || !APP_DEBUG) {
        return;
    }

    $message = is_string($value)
        ? $value
        : json_encode(
            $value,
            JSON_UNESCAPED_SLASHES |
            JSON_UNESCAPED_UNICODE |
            JSON_PRETTY_PRINT
        );

    error_log("[$label] $message");
}
Usage:
debug_log($user, 'USER');
debug_log($_POST, 'POST');
debug_log('Beginning checkout', 'CHECKPOINT');
The main benefit is abstraction.
Today your function might call:
error_log()
Later it could send information to:
Monolog
syslog
Ray
OpenTelemetry
a WebSocket
a remote logging server
without changing every debugging call throughout the project.
Custom Real-Time Debugging
Custom real-time debugging approaches are useful when ordinary request-based logging is too limited for the environment you are working in. Instead of tying diagnostics to a single HTTP response, the application can send debugging information to a separate local service or stream it continuously to another process or browser client. This can be helpful with background workers, long-running processes, remote development environments, or systems where several components need to report into the same debugging view. The trade-off is additional complexity, so these techniques are usually most appropriate when simpler logging and debugging tools no longer meet the need.
21. Post Debugging Data to a Local Logging Server
You can also build or run a small service that accepts debugging messages from your PHP application.
For example:
function remote_debug(mixed $data): void
{
    $ch = curl_init('http://127.0.0.1:9000/log');

    curl_setopt_array($ch, [
        CURLOPT_POST => true,
        CURLOPT_POSTFIELDS => json_encode($data),
        CURLOPT_HTTPHEADER => [
            'Content-Type: application/json',
        ],
        CURLOPT_RETURNTRANSFER => true,
        CURLOPT_TIMEOUT_MS => 200,
    ]);

    curl_exec($ch);
    curl_close($ch);
}
Then:
remote_debug([
    'event' => 'order.created',
    'order_id' => $order->id,
]);
The receiving logging server could be written in:
PHP
Node.js
Python
Go
C++
or practically anything capable of accepting HTTP.
This is useful when working with:
- Docker
- remote servers
- WSL
- virtual machines
- APIs
- background workers
Synchronous logging requests should generally be avoided in performance-sensitive applications, however. If the logging server is unavailable, you do not want normal application requests waiting for it.
22. Stream Debugging Information with WebSockets
For more advanced debugging systems, PHP events can be streamed to a browser or debugging application using WebSockets.
Conceptually:
PHP Application
      │
      │ debug event
      ▼
Message Broker / WebSocket Server
      │
      ▼
Browser Debug Client
      │
      ▼
console.log(...)
The server might send:
{
    "level": "debug",
    "message": "Payment request started",
    "order_id": 527
}
JavaScript could receive it:
socket.addEventListener('message', event => {
    const message = JSON.parse(event.data);

    console.log('[PHP]', message);
});
This provides true real-time debugging and can even include activity from workers or background processes that are unrelated to the current HTTP response.
The trade-off is complexity.
Any debugging WebSocket must be carefully protected. Internal queries, stack traces, customer information, credentials, or other sensitive application data should never be broadcast to unauthorized clients.
Production Logging and Observability
Once an application reaches production, debugging becomes less about printing a single variable and more about understanding what happened across requests, servers, workers, queues, and external services. Production systems need logs and telemetry that can be searched, correlated, retained, and reviewed after an incident has already occurred. Centralized logging and observability platforms help bring that information together so developers can trace failures, identify patterns, and investigate problems without logging into each server individually. These tools are also useful for alerting, historical analysis, and understanding the broader behavior of an application over time.
23. Centralized Logging and Error Monitoring Services
Production applications commonly send logs and errors to centralized services.
Examples include:
Papertrail
Loggly
Better Stack
Sentry
Datadog
Elastic / Elasticsearch-based systems
Grafana Loki
These services can provide capabilities such as:
- searching logs
- filtering by application or server
- retaining historical logs
- exception tracking
- alerts
- dashboards
- aggregation from multiple servers
- correlation between events
- user-impact analysis
Laravel can send logs to remote systems through its Monolog-based logging channels. Its current logging configuration includes a built-in Papertrail channel, for example.
For applications running across several servers or containers, centralized logging is significantly easier to work with than SSHing into each machine and manually searching files.
24. Laravel Nightwatch
Laravel Nightwatch is Laravel's hosted application-monitoring platform. The Laravel package used to connect an application to the service is laravel/nightwatch:
composer require laravel/nightwatch
It goes considerably beyond ordinary logging and tracks application events such as:
- requests
- exceptions
- database queries
- outgoing HTTP requests
- jobs
- mail
- notifications
- commands
- cache operations
- scheduled tasks
Nightwatch also provides searchable logs and connected timelines that show how application events relate to one another.
For a modern Laravel application, this is an important production-oriented option to know about.
It serves a different purpose from Laravel Debugbar or Telescope:
Debugbar / Telescope
    → primarily development diagnostics

Nightwatch
    → production application monitoring and observability
25. OpenTelemetry
OpenTelemetry for PHP represents the modern vendor-neutral approach to application observability. Its PHP implementation is not a single all-in-one package; it is split into API, SDK, instrumentation, and exporter packages. The official documentation recommends installing only the pieces you need. For OTLP export, for example, the documented exporter package is OpenTelemetry OTLP exporter documentation:
composer require open-telemetry/exporter-otlp php-http/guzzle7-adapter
Rather than being another console.log() replacement, OpenTelemetry provides standards and libraries for generating and correlating:
The important advantage is correlation.
A production request can potentially be associated with:
Trace
 ├── HTTP request
 ├── database query
 ├── external API call
 ├── log message
 └── background operation
rather than having completely separate log files with no relationship between them.
OpenTelemetry can send telemetry to many different backends rather than tying the application to a single monitoring vendor. The OpenTelemetry PHP exporter documentation explains the concrete exporter packages and transports used to do that.
For large applications, distributed systems, microservices, or systems running across several servers, containers, or services, OpenTelemetry is increasingly more relevant than simply thinking in terms of individual log files.
Related Monitoring and Profiling Tools
Monitoring and profiling tools are closely related to debugging, but they answer different questions than ordinary logging. Instead of focusing mainly on individual messages or variable values, they help explain application health, performance, resource usage, slow requests, expensive queries, and other system-wide behavior. These tools are especially useful when an application appears to be working correctly but is slower, less efficient, or less stable than expected. They complement logging and debugging rather than replace them, giving developers a broader view of how the application behaves under real workloads.
26. Laravel Pulse
Laravel Pulse provides an application-health and performance dashboard.
It focuses on information such as:
- slow requests
- slow jobs
- slow database queries
- application usage
- queue activity
- exceptions
- server CPU
- memory
- disk usage
Laravel's own documentation distinguishes Pulse from Telescope: Pulse provides broader application-performance and usage information, while Telescope is recommended for detailed debugging of individual events.
That distinction is useful:
Telescope
    → Why did this particular request do this?

Pulse
    → What is happening across my application overall?
Pulse is therefore worth knowing about, even though it is not a direct console-logging solution.
27. Blackfire
Blackfire is primarily a performance profiler.
Instead of asking:
What value does $user contain?
Blackfire is designed to help answer questions such as:
Why does this request take 1.8 seconds?
or:
Which function is consuming most of the CPU time?
It can profile:
- HTTP requests
- CLI commands
- function calls
- CPU usage
- memory allocation
- SQL activity
- performance bottlenecks
Profiles can be triggered through Blackfire's browser extension or command-line profiling workflows.
Blackfire therefore complements tools such as Xdebug, Telescope, and application logging rather than replacing them.
Legacy Browser Console Solutions
Several older tools solved the PHP-to-browser-console problem by combining server-side PHP libraries with browser extensions and specially formatted HTTP headers. These tools were important because they provided a practical way to inspect server-side values directly in browser developer tools before more modern debugging systems became common. You may still encounter them in older codebases, documentation, or long-lived development environments, so it is useful to understand what they do and how they fit into the history of PHP debugging. For new projects, however, they should generally be treated as compatibility or maintenance options rather than preferred choices.
28. FirePHP
FirePHP was one of the original tools for sending server-side PHP debugging information into Firefox developer tools. On the PHP side, the corresponding server library is FirePHPCore:
composer require --dev firephp/firephp-core
The PHP application would then send specially formatted HTTP headers:
<?php

require __DIR__ . '/vendor/autoload.php';

$firephp = FirePHP::getInstance(true);

$firephp->log($user, 'Current User');
$firephp->warn('This is a warning');
$firephp->error('Something failed');
The Firefox extension would decode those headers and display the information in developer tools.
Conceptually:
PHP
  ↓
FirePHP / Wildfire headers
  ↓
Firefox extension
  ↓
Developer console
FirePHP was influential because several later tools used essentially the same overall idea.
It is now better considered a legacy-oriented solution compared with modern tools such as Clockwork, Chrome Logger, Xdebug, or dedicated PHP debugging systems.
29. Webug
Webug provided FirePHP-style debugging support for Chrome. It used the same FirePHP/Wildfire headers generated by server libraries such as FirePHPCore. The Webug Chrome extension itself is obsolete and is no longer available in the Chrome Web Store; an archived extension listing documents its last release and Manifest V2 status.
PHP would generate FirePHP/Wildfire debugging headers and the Webug extension would display them inside Chrome.
This was useful when FirePHP itself was strongly associated with Firefox.
Webug is now effectively a legacy tool and should primarily be mentioned for completeness or when maintaining an older system that already uses it.
For a new application, Chrome Logger or Clockwork would be more appropriate if browser-integrated server debugging is desired.
30. PHP Console
PHP Console was another PHP-to-Chrome debugging system. Its server library is the PHP Console package Composer package:
composer require --dev php-console/php-console
It could then be used with calls such as:
<?php

require __DIR__ . '/vendor/autoload.php';

PhpConsole\Helper::register();
PC::debug($user, 'user');
The PHP library transported the debugging information using HTTP headers and its Chrome extension displayed the values inside developer tools. The extension's source is preserved in the PHP Console Chrome extension repository.
PHP Console also supported additional functionality including PHP errors and exceptions.
However, the ecosystem around the project is now old enough that it should be treated as a legacy solution rather than something to choose for a new project.
Which Approach Should You Use?
There is no single PHP equivalent of JavaScript's console.log() because PHP normally executes on the server and the browser console exists on the client.
For a quick one-off test on an HTML page:
echo '<script>console.log(' . json_encode($value) . ');</script>';
is sufficient.
If you specifically want PHP values in Chrome DevTools, Chrome Logger is designed for that purpose.
If you want a richer browser-based PHP debugging environment, Clockwork is a much better fit.
For Laravel development, the most useful tools are usually some combination of:
Laravel Debugbar
Laravel Telescope
Laravel Pail
Ray
Xdebug
depending on whether you are inspecting a web request, viewing logs, dumping variables, or stepping through program execution.
For Symfony development, VarDumper and Symfony Web Profiler provide excellent built-in debugging workflows.
For plain PHP, strong modern choices include:
Xdebug
Symfony VarDumper
Ray
Tracy
Monolog
For application logging, use a real logging system such as Monolog, Laravel's Log facade, error_log(), or syslog rather than sending debugging information to the visitor's browser.
For production applications, centralized logging and observability systems such as Sentry, Datadog, Papertrail, Better Stack, Laravel Nightwatch, or an OpenTelemetry-based stack are much more appropriate.
For performance problems, use a profiler such as Blackfire rather than adding hundreds of timing log statements.
Finally, keep debugging tools separate from production output. Development tools frequently collect SQL queries, paths, request data, environment information, stack traces, and other internal details that should never be exposed to ordinary visitors.


-
0
This questions was created since its commonly asked, we also have an example Browser Console Log using PHP snippet.
— Brian Wozeniak
add a comment